DirtViz Web Platform Guide
DirtViz is the web portal and visualization service for the ENTS ecosystem. It ingests measurements from deployed sensing nodes, stores them in a time-series database, and provides an interactive web interface for data exploration and export.
1. Account Access and Setup
- Open your browser and navigate to https://dirtviz.jlab.ucsc.edu/.
- Log in using your Google account via the OAuth sign-in button.
- Once authenticated, click on your profile icon in the top navigation bar to open user management.
2. Managing Cells and Loggers
DirtViz separates the physical sensing location (Cell) from the hardware device (Logger):
- Cell: Represents the physical deployment site, experimental bed, or microbial fuel cell.
- Logger: Represents the specific electronic ENTS node that records measurements.
Creating a Cell
- In your DirtViz profile, navigate to the Cells tab.
- Click Create Cell.
- Fill in the required fields:
- Name: A descriptive identifier for your deployment (for example,
UCSC-Farm-Bed-3). - Location / Coordinates: Latitude and longitude for map visualization (placeholder coordinates can be used if not yet determined).
- Click Save.
- Note the generated Cell ID (an integer). You will enter this ID during the on-board hardware captive portal configuration.
Creating a Logger
- In your DirtViz profile, navigate to the Loggers tab.
- Click Create Logger.
- Enter the device identifiers provided with your ENTS board:
- DevEUI: 16-character hexadecimal identifier.
- JoinEUI: 16-character hexadecimal identifier.
- AppKey: 32-character hexadecimal key. (Note: These identifiers are also displayed in the serial boot output if you connect the board over USB; see Diagnostics and LEDs).
- Click Save.
- Note the generated Logger ID (an integer). You will enter this ID during on-board captive portal configuration.
3. Visualizing Sensor Telemetry
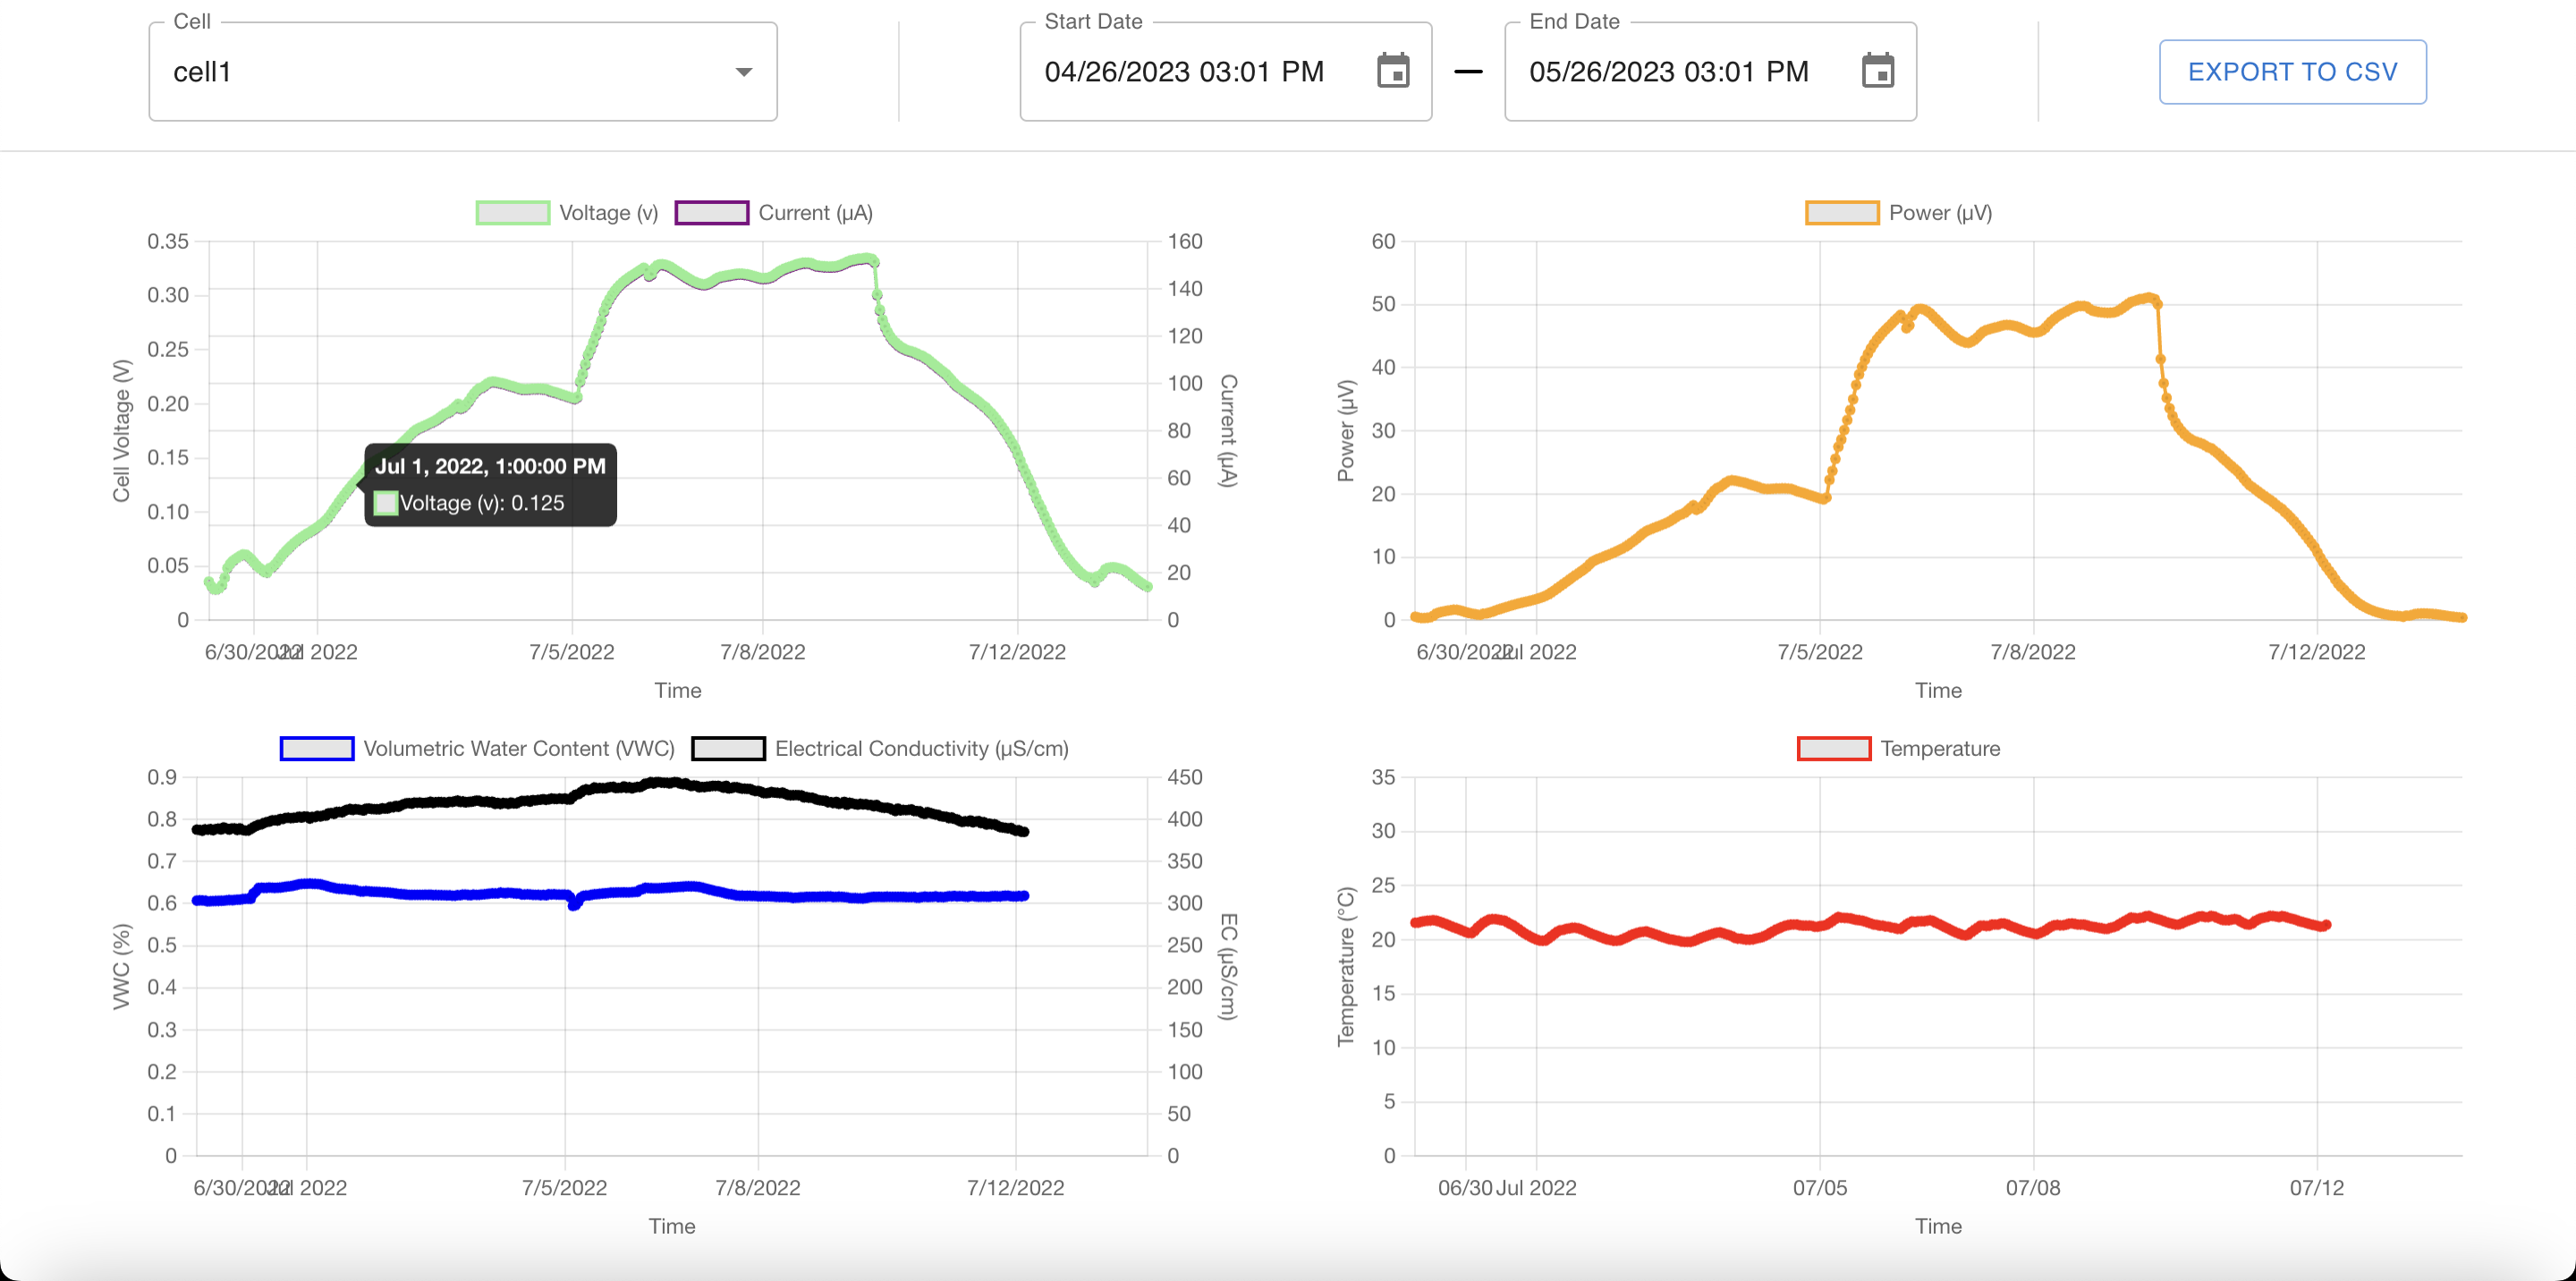
Dashboard Controls
- From the main dashboard, select your Cell from the dropdown menu or click its pin on the interactive map.
- Choose the measurement channels you wish to display (for example, Voltage, Current, Power, Soil Moisture, or Soil Temperature).
- Select your desired time range. To view real-time data as it arrives from the field, ensure the end date is set to a future timestamp.
- Toggle the Livestream button to automatically refresh the graphs as new packets are ingested.
4. Exporting Data
DirtViz provides raw CSV data downloads for analysis in external computational environments:
- On the dashboard graph view, click the Export CSV button in the upper-right corner of the plot.
- Select the date range and channels to include in the export.
- Save the resulting
.csvfile.
Loading Data in Python
import pandas as pd
import matplotlib.pyplot as plt

# Load exported DirtViz CSV data
df = pd.read_csv("dirtviz_export.csv", parse_dates=["timestamp"])
df.set_index("timestamp", inplace=True)

# Display basic statistics
print(df.describe())

# Plot measurements
df.plot(subplots=True, figsize=(10, 6))
plt.tight_layout()
plt.show()